Missed prediction
P1 missed once
- Predicted: 0,3 or less
- Measured: 0,4
Eerste monteur service W · bbl · months to a first job
The service W route took 0,4 months to a first job. Reported as a miss, not rounded away.
Is it me, or the market?
Why do employers in techniek and zorg get so few applicants? I built a study from official data, retracted my own first headline after a validity audit, and confirmed the finding with a preregistered test: the starter you're looking for already has a boss.
DUO · diploma year 2025
Already had a boss on diploma day
Confirmed with a preregistered test · 9 of 9 routes pass
In short
Each version keeps its colour further down the page, so you can jump to the part you need.
v1 · Sun 08:36 · Draft headline
3,8
new designers per starter job, from my own count of 153 ads. It agreed with my hunch.
How the number was made
v2 · Sun 12:16 · Retracted
3,8
Counted honestly, design and techniek overlap. I took the headline off the page.
Strict starter · 90% interval · overlap in yellow
v3 · Sun 18:40 · Published
9 of 9
routes in techniek and zorg start faster than design, in a test I froze before looking.
9 pass · 1 route not published by ROA
Part 1 of 3 · v1 Draft
Short answer
From a hunch. UWV doesn't measure designers, so I counted 153 job ads myself. The count agreed with me.
01 · The question
Half 1 · the market
Is it the market?
Answered with official data per trade
Half 2 · their own hiring
What should I change?
Answered with job ads and published research
In the news
The market is cooling, on average. Per trade, it isn't.
Open vacancies per person on WW, by job
UWV tension index, Q2 2026 · capped at 16
The argument to test
My own hypothesis, not a findingThe page exists to earn trust, so readers ask for the free Afhaakcheck. One overclaim a reader sees through costs more than a weaker headline.
02 · Measures
Four checks for every measure. A rejected measure failed where the orange mark is.
| Measure | Official source UWV, CBS, DUO or ROA | Per job One figure per job | Comparable Same method, every job | Direct Measures the thing itself |
|---|---|---|---|---|
| Used · 6 | ||||
| Shortage per job UWV tension index Same formula for 93 job groups. WW only, so read the order. | ||||
| How hard the start is ROA school-leaver survey Measures the outcome itself, 6 cohorts pooled. | ||||
| Who fills the jobs bbl share of mbo diplomas (DUO) Shows who already had an employer before the diploma. | ||||
| Supply against demand Diplomas (DUO, CBS) against new vacancies (UWV) My own request. Diplomas aren't supply, and vacancies aren't entry jobs. | ||||
| The national picture CBS vacancies per 100 unemployed What readers hear in the news. One average for all trades. | – | |||
| Experience asked Own job-ad study (H4) No public source splits experience per job. Running until 7 Dec. | ||||
| Rejected · 4 | ||||
| Supply against demand "Graduates per starter vacancy" A ratio of three uncertain parts, from ads on different sites. | ||||
| Vacancies before 2023 The pre-2023 vacancy estimate A constant share of the sector, applied backwards. It looked like data. | – | |||
| Vacancy rate Vacancies per 100 workers A fair rate, but its job set and denominators didn't match. | ||||
| Popular figures Two figures from the news Only second-hand, or from a vendor case study. Neither was used. | – | – | – | |
03 · Exploration
The brief came in on Saturday at 23:03: show job demand per trade against qualified people, from credible sources, with design as the example of an employer's market. I explored in three rounds that night.
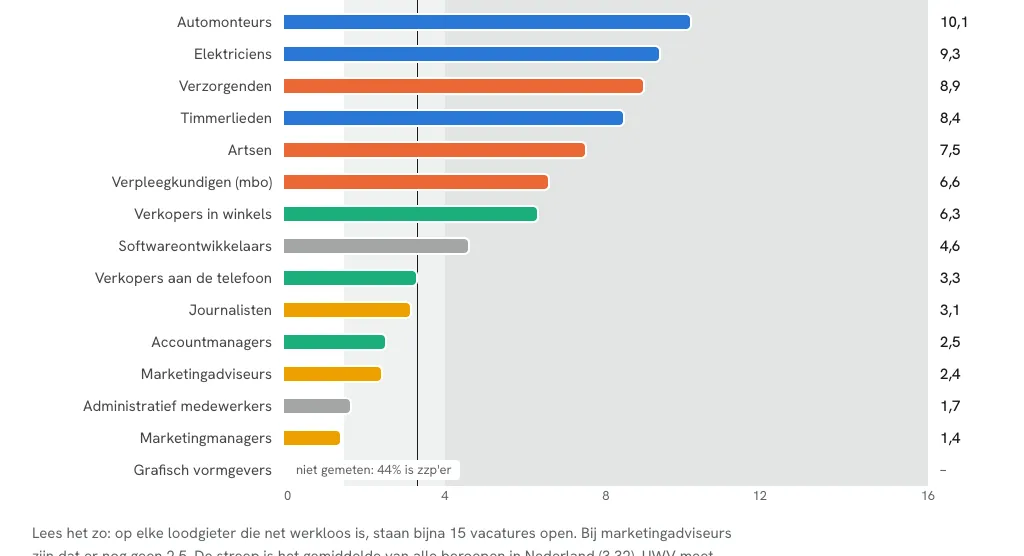
UWV doesn't measure designers, and the creative class as a whole is still "krap" (2,15). So "more designers than jobs" can't be shown with UWV's own measure.
Design comes out about 1 to 1.
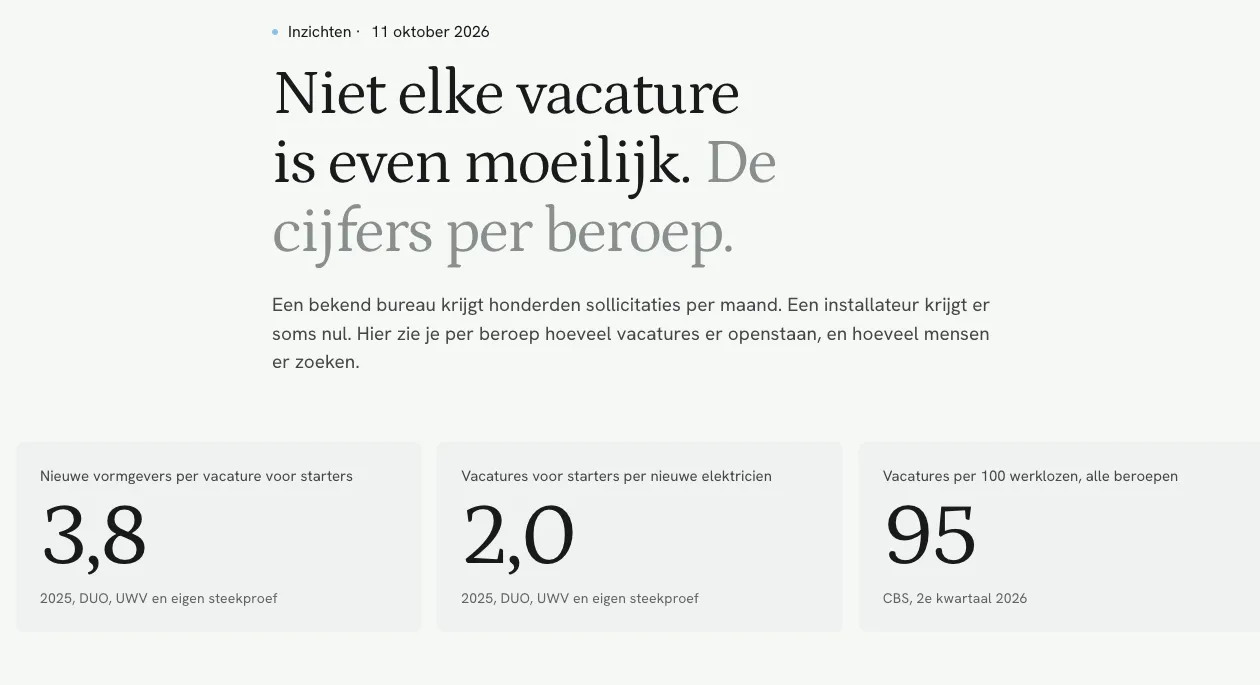
One coder. 3,8 new designers per starter vacancy in design, against 2,0 starter vacancies per new electrician.
Became the draft headline at 08:36
Sun 12 Oct, 00:34 · after round 2
The hunch that shaped round 3
"I don't want to agree on the design part yet. Is there a way to find out the years of experience needed for each graphic design job opening?" Part 2 of 3 · v2 Retracted
Short answer
Before publishing, I audited my own study. It found a problem on every type of validity. Counted honestly, design and techniek overlap.
04 · The retraction
Before publishing, I re-derived every number from the raw files and scored 29 page items keep, fix or drop. The official numbers held. The headline didn’t.
Drafted Sun 08:36 · never public
New designers per starter vacancy
3,8
2025 · DUO, UWV and own sample
Starter vacancies per new electrician
2,0
2025 · DUO, UWV and own sample
Graduates per starter vacancy, 2025
Median and 90% interval · Monte Carlo, 40,000 draws
The audit opened 7 issues against the headline
Sun 12 Oct, 12:03–12:16 · every number re-derived from the raw files
Validity 6
Found later 1
Verdict
Exploratory only. Off the page.
The method note on the live page
"In een eerdere versie stond een eigen telling van 153 vacatures. Die was te klein en kwam van verschillende sites, dus ik heb hem eruit gehaald." Part 3 of 3 · v3 Published
Short answer
A test I froze before looking: 9 of 9 routes pass. The literature backs the advice, and two more tests report in December.
05 · The test
The design outcomes and some techniek outcomes had already been seen, so they could only describe. The test used routes I hadn't seen. I froze the predictions and the pass rule with a hash before opening the data.
How the test routes were picked
Preregistration · frozen
SHA-256 e0aa1c03…Sun 12 Oct, 12:29
Written down before I opened the data.
Predictions, written down before looking
17 of 18
checks held. The miss: service W at 0,4 months.
≤ 2,0% unemployed · ≤ 0,3 months · ≥ 65% own field
All held
No misses.
≤ 3,0% unemployed · ≤ 0,5 months · ≥ 70% own field
In direction
The intervals overlap per programme, so it’s not a proven gap.
≤ 1,0 months · unemployment above its bbl route
9 of 9
evaluable routes beat both design figures.
Beats 7,2% unemployed and 1,9 months
The rule for the main test, also written first
9 of 9 routes start faster than design, on both measures
About 1 year after the diploma · ROA, 6 cohorts pooled · routes I hadn’t looked at
Unemployed, %
Months to a first job
Wilson 95% intervals · scored Sun 12 Oct, 12:58
Missed prediction
Eerste monteur service W · bbl · months to a first job
The service W route took 0,4 months to a first job. Reported as a miss, not rounded away.
Deviation, logged
Missing counts as a fail 9 of 10 · supported
Missing left out 9 of 9 · supported
Supported needs 9 or 10 of 10. Both readings land there.
ROA publishes no outcomes for it, and the plan hadn't said how to treat missing data. So both readings are reported.
Counter-signal, kept on the page
Unemployed 1 year after the diploma · n = 102 · 95% interval 3,1–12,9%
Close to design. ROA rates this mbo-3 route "slecht", like mbo-4 media design. It fits a quieter thesis: techniek employers prefer starters who already have practice.
06 · Testing the argument
So each claim in the essay needed its own evidence, traced to the source. A claim I couldn't verify was dropped or reworded.
19 studies traced to the source, by DOI
Rules, written before checking
7 claims in the essay
Safe 4
Well-known employers get more applicants
Say “research in the US”.
Turban & Cable 2003; Collins & Han 2004
How you treat applicants affects whether they want you
With no numbers.
Chapman et al. 2005; Uggerslev et al. 2012 (meta-analyses)
A fast offer gets more yeses
With no “within X hours”.
Becker et al. 2010 (n = 3,012)
An honest picture of the job keeps people longer
With no percentage.
Earnest et al. 2011; Phillips 1998
Reworded 2
Show the pay and you get more applicants
Good pay shown draws people; a low wage shown can push them away.
Banfi & Villena-Roldán 2019; Balgova et al. 2025; Belot et al.
Long applications lose applicants
Mostly vendor data, and one large study contradicts it. Say “keep the first step short”.
Hardy et al. 2017 (222,772 job seekers)
Dropped 1
No primary source.
—
Closest support for the thesis
The data can't test the employer half. The closest study found that the recruiting that works depends on how well-known the firm is.
Collins & Han (2004)
Which recruiting works better, by employer profile · abstract only, US firms
| Low-effort recruiting | High-effort recruiting | |
|---|---|---|
| Well-known firm | – | Works better |
| Low-profile firm | Works better | – |
07 · What the evidence supports
The official data carry the claims; my own data is described in a plain method note. Every claim on the page gets the strength it earned. The one I can't support yet isn't on the page.
| Strength | Claim | Source |
|---|---|---|
| Confirmed | In techniek and zorg a starter has work within about 2 weeks; a design graduate searches 8 to 12 | ROA, 6 cohorts · preregistered H1 |
| Descriptive | 9 of 10 new electricians and installatiemonteurs already had a boss at their diploma; designers 0 of 10 | DUO 2025 · official |
| Descriptive | 6,5 new vacancies per new electrician in 2025; design about 1 (with the caveats in 02) | DUO, CBS, UWV |
| Descriptive | Monteurs in Brabant: 9 to 16+ open vacancies per person on WW | UWV Q2 2026 · official |
| Descriptive | The market cools nationally, but not in techniek and zorg | CBS, UWV · out-of-sample check H3 pending |
| Direction only | School leavers in techniek without practice have a slightly harder start | ROA · the intervals overlap |
| Argument | Don't copy big-brand hiring; make it easy for the applicant | Verified research where stated (06) |
| Not claimed | Ads in design ask for more experience | Measured until 7 Dec · H4 |
What the data can’t tell you, so the page doesn’t claim it.
Public sources only. What the data collector for H4 does and doesn't do:
Corrections are public in the plan, including the robots.txt mistake.
08 · Still running
Both were written down before any data came in, and both report in December. The results go on the page whichever way they fall.
Ads needed per job, out of a planned 150
Planned: 150 = about ±10 points. H4a needs ~65. H4b needs ~180.
How H4 closes the old issues
The ad study, done properly · 13 Oct → 7 Dec · design fixed before any data
From the audit 7
Added before the start 2
09 · Learnings
A number that agrees with you deserves the hardest check. The sample was designed after a result I didn't like, and it found what I hoped. That was exactly the moment to audit.
Write down what you expect before you look. Then a pass means something, and a fail would have changed the headline. I said so in advance.
Measure the reader's question directly. "How fast do starters find work?" beat a ratio built from three uncertain parts.
Validity is more than sample size. The old sample's biggest problems were a label, a source and a sampling method, not n.
A market fact needs the part the reader controls. Otherwise "it's the market" becomes an excuse not to act.
Publication
The findings went live as a Dutch data story at talentbezorgd.com/inzichten/krapte: one measure per chart, the reader picks their trade once and every chart follows it, every chart has a table, and a method note names the sources, the preregistered test and the retracted sample.
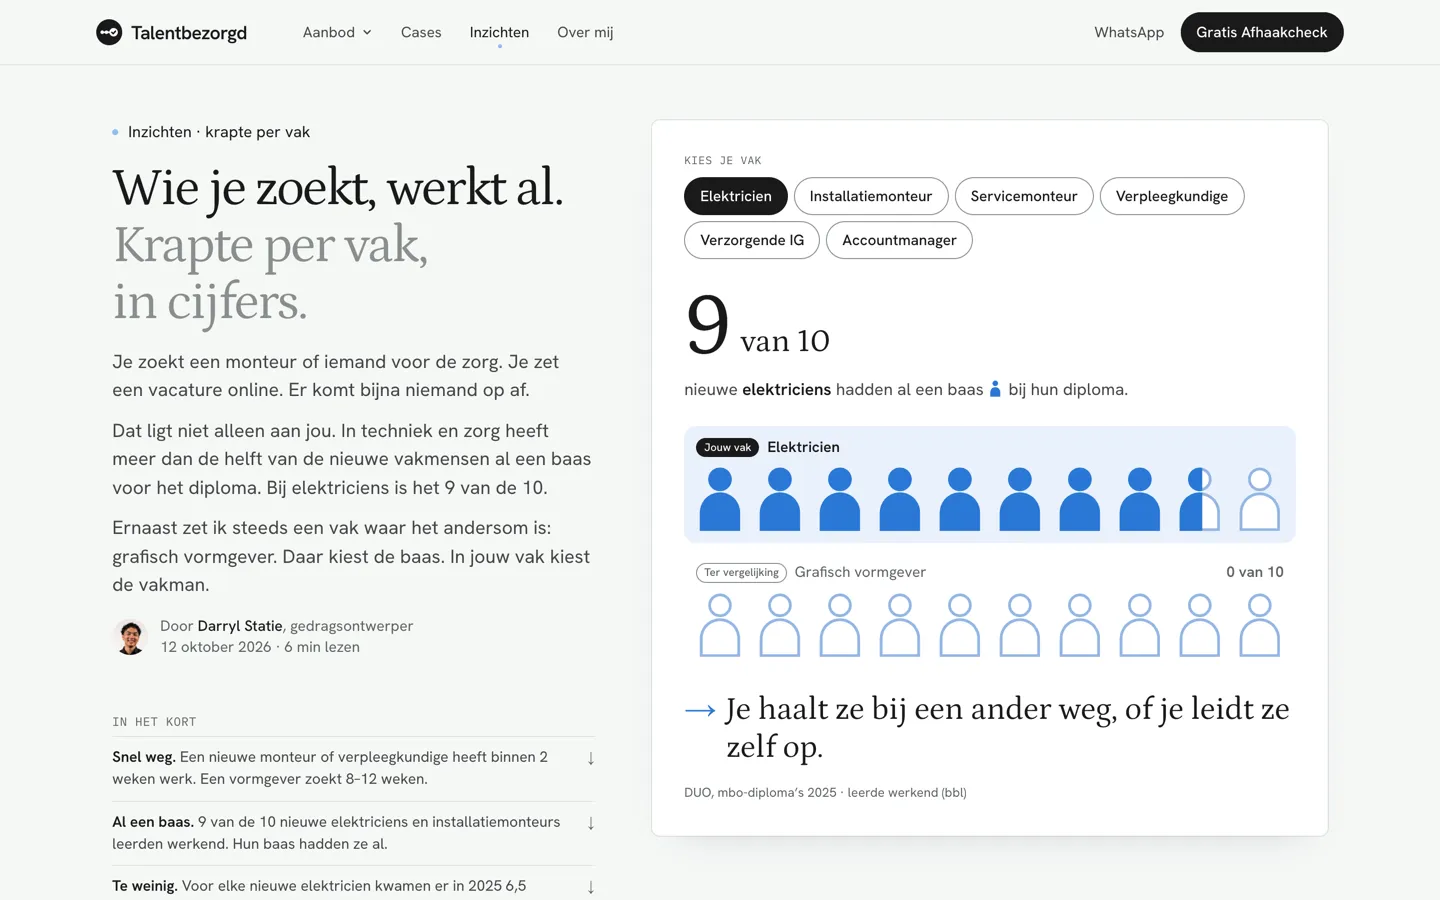
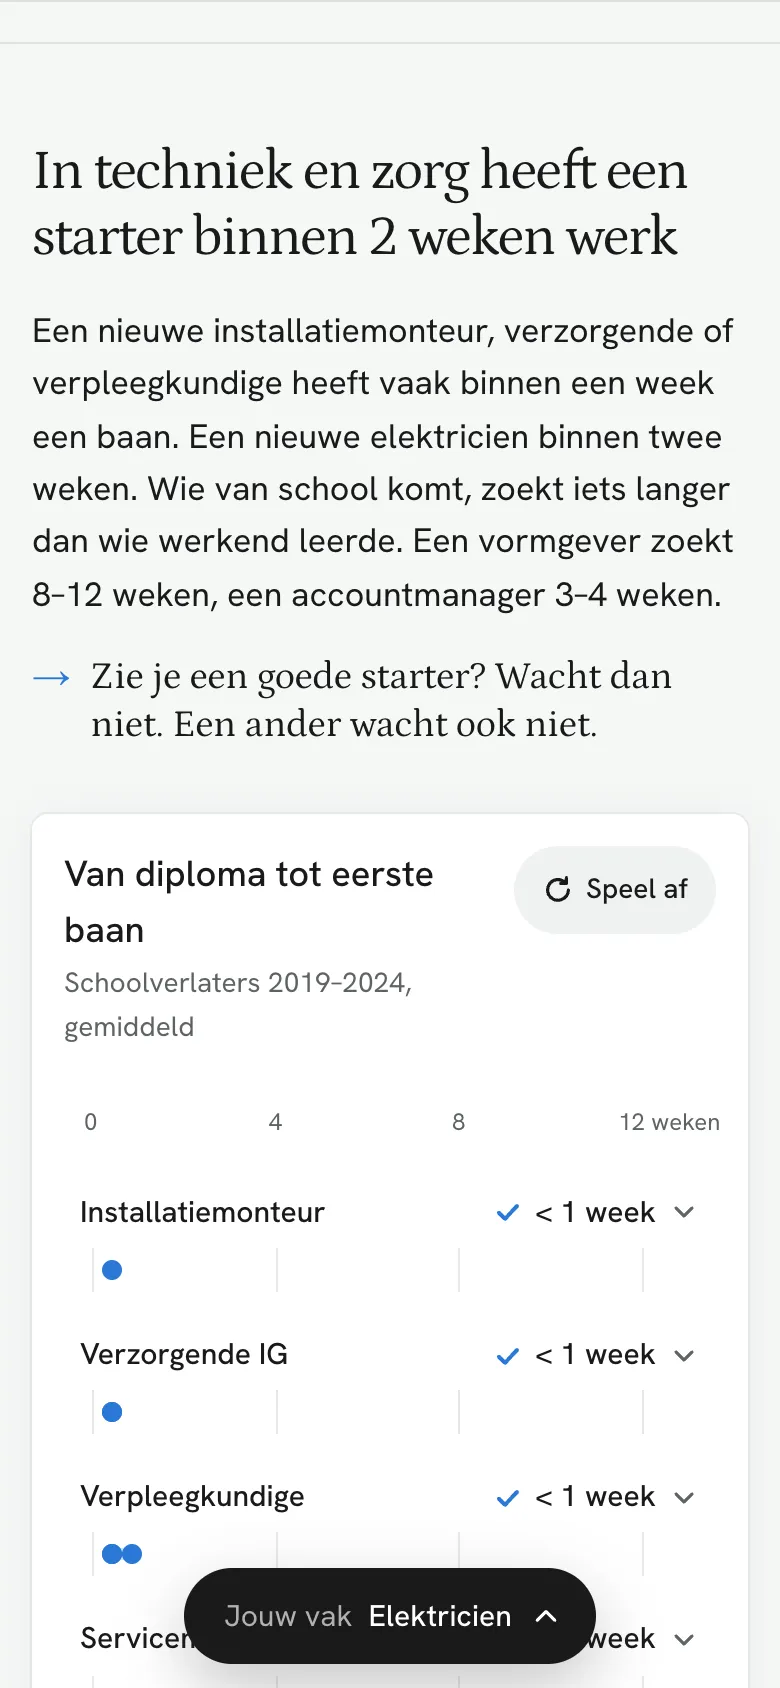
How the findings reach an employer
Every market fact ends with the part the reader controls: "Zie je een goede starter? Wacht dan niet."
Official data carry the claims. My own data sits in a plain method note.
One frame for numbers: counts out of 10, like "9 van 10 nieuwe elektriciens hadden al een baas".
The page opens on the reader's own trade; design only appears "ter vergelijking".
More work
A free job-ad checker that marks problems while you type. Testing showed free AI does the same job, so I stopped it on day 3.
Nobody signed up after 200,000+ ad views. I found out why and redesigned the page: from 0 to 20 sign-ups.
Available for freelance work now. Remote, or on-site anywhere in the Netherlands.